
Check if your system is performing correctly!
The VRM Monitor is one of the best options to check if the system is recording correctly, providing a quick overview as well as detailed information about all the cameras and storage added to VRM.
In this article you are going to see how to access VRM Monitor from Bosch Video Management System (BVMS) Configuration Client. Furthermore, you will find here some useful information about each section on the Dashboard page.
📚Overview:
Step-by-step guide
-
Open Configuration Client and login using your admin credentials
-
Form the Devices tab > expand the VRM Devices > go to your VRM device >right click on it and select Show VRM Monitor
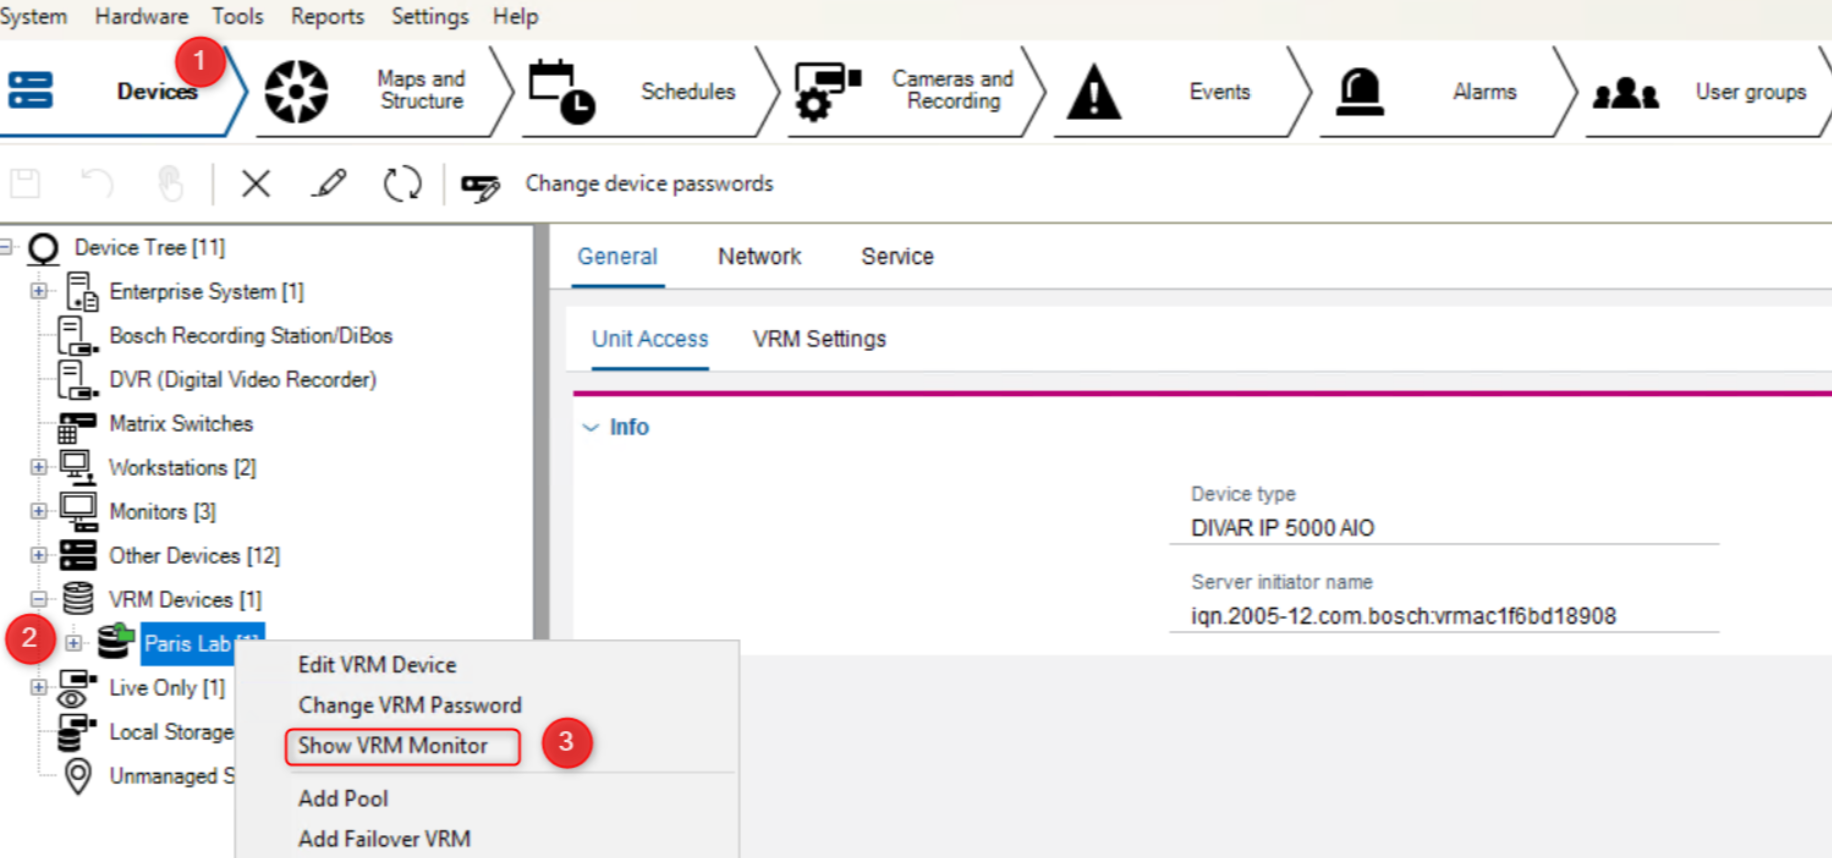
VRM Dashboard
The VRM Monitor window should appear.
The other option to access VRM monitor page is by using a web browser: enter the IP address (or URL) of the VRM Server. Example: <http://<VRM_Server_IP_Address>>
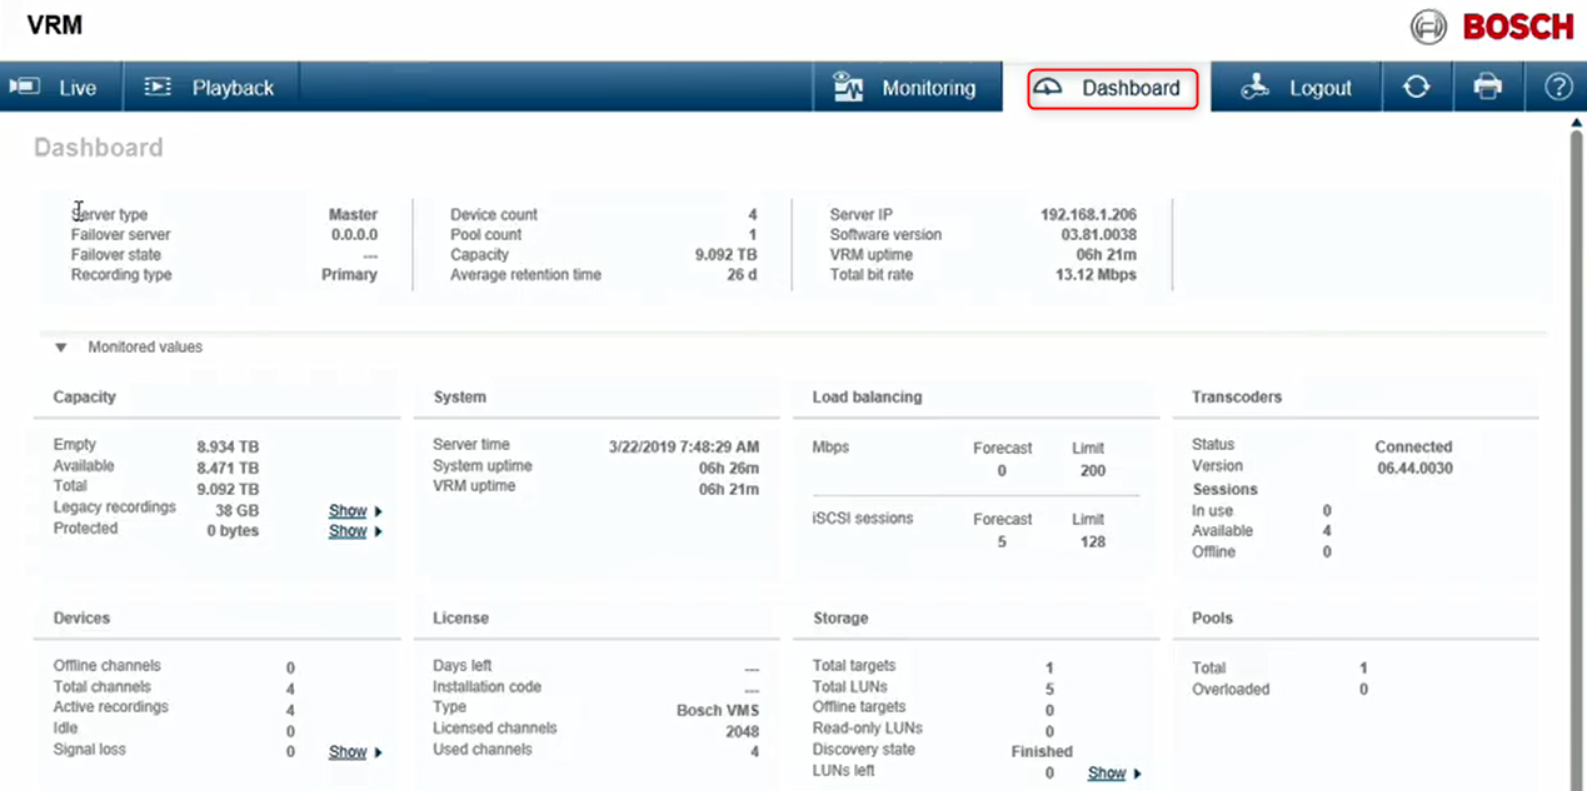
This is the overview of VRM Dashboard page, version 3.60:
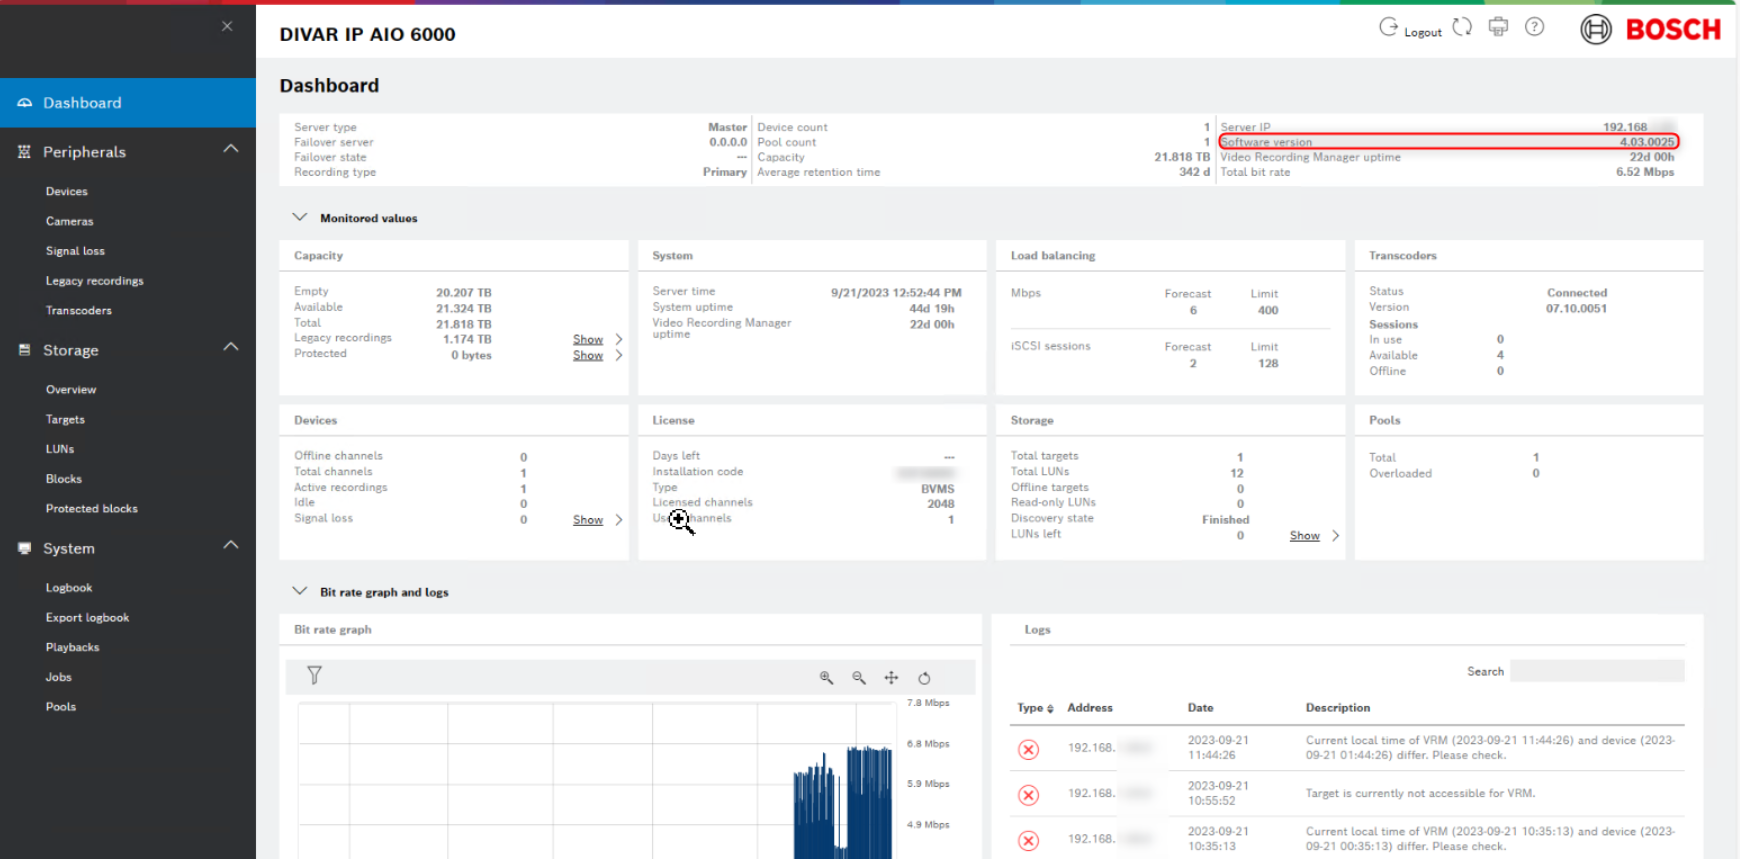
This is the overview of VRM Dashboard page, version 4.03 or above:
Under the Dashboard you are going to find very comprehensive information about your system. Such as:
-
General information about the VRM Server, the Server IP Address.
-
The Average Retention time which means how many days can the system record without overwriting.
-
VRM Uptime - for how long time has the VRM server been functioning.
-
The total bit rate - pay attention at the total bit rate so as not to exceed the hardware limit. If it exceeds the hardware limit, it means that your system may stop recording.
-
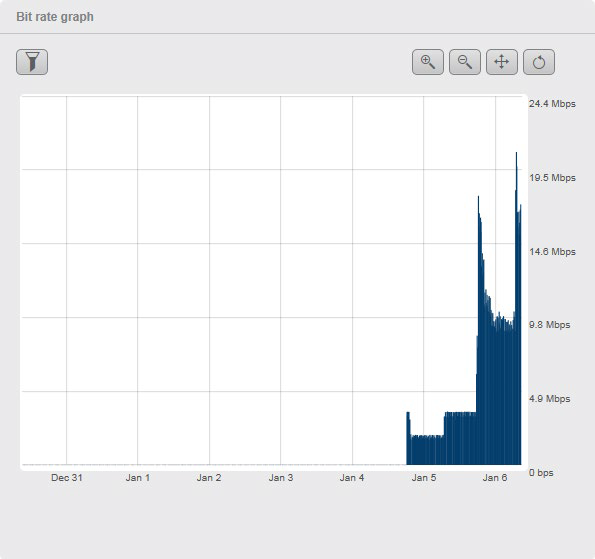
At the bottom part of the Dashboard page, you can find the graphical representation of the bit rate for a longer period of time
-
Capacity overview: Here you can check the storage available which it can give you a hint whether you need to add more storage or delete some of the old recordings.
-
In Transcoders section you can see how many transcoder sessions are available on your system.
-
Logs of the system: here you can see the list of warnings or errors in case of malfunctions.
Navigating the Dashboard:
The Dashboard provides a wealth of system information at a glance. While this page can seem overwhelming at first, we will cover each portion of this page section by section:
-
General Information
-
Monitored Values
-
Graphs and Logs
-
General Information
The general information portion of the “Dashboard” provides base system information:
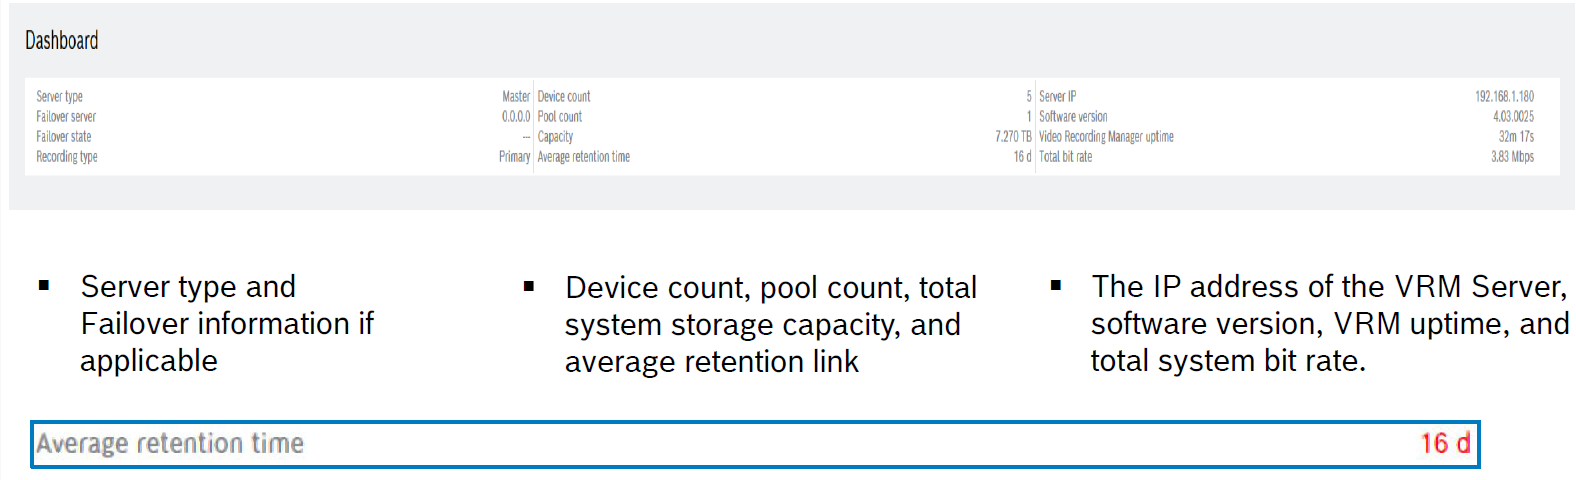
Average retention time is how many days of video you will have recorded before the video will start overwriting. This is a Realtime configuration that may not meet your minimum retention time. If you set your minimum retention time to 30, and you don‘t have enough storage to cover all 30 days you will not see 30 here. You will see your actually retention time. This may not be accurate when you initially set up a system remember: If this is in red then based on your settings you will not meet your minimum retention time
VRM assumes the following on a NEW system:
-
Each block issued can store 6 hours worth of video
-
Based on VRM Server downtime settings, VRM will issue the number of blocks needed to cover the specified time
Example:
Downtime of 4 days = 4 blocks per day x 4 days = 16 blocks (+ 1 mounted +1 pre-mounted)
After 5 blocks are consumed, VRM will calculate how many blocks the camera actually needs to cover VRM downtime. At this point you will see a more accurate retention time. In this scenario, based on the camera recording settings (IEI & Bitrate), VRM is estimating that you will have 20 days of video stored on your target before it will start to override. Now this value may fluctuate if you have alarm recording, scenes that consistently have gotten busier, or if you make changes to your recording settings.
If the average retention time is in red, that means you current settings will not meet your minimum retention time. To fix this, you will need to reduce the data rate, change the minimum retention time, or add storage.
Total Bit Rate –The combined bandwidth of all your devices
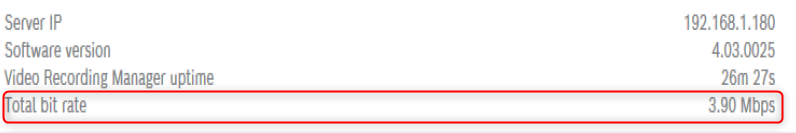
Bit rate plus your frames per second will equal your bandwidth and have a direct correlation with your storage capacity. Furthermore, a depending on what DIP AIO or server you have, you will have a max throughput. If you run into scenarios where you are losing video, you can come here to check to see if you are maxing out on your throughput; it’s also good to check the load balancing to make sure you are under the limit. If you do notice a high bit rate, this is when you can look at the bit rate graphs for your storage and devices to find out what camera is causing it and at what time of day. There are several factors that can cause a spike in bitrate or a camera’s bitrate being too high. One would be the camera and recording setting and the other would be based on how busy the scene is.
-
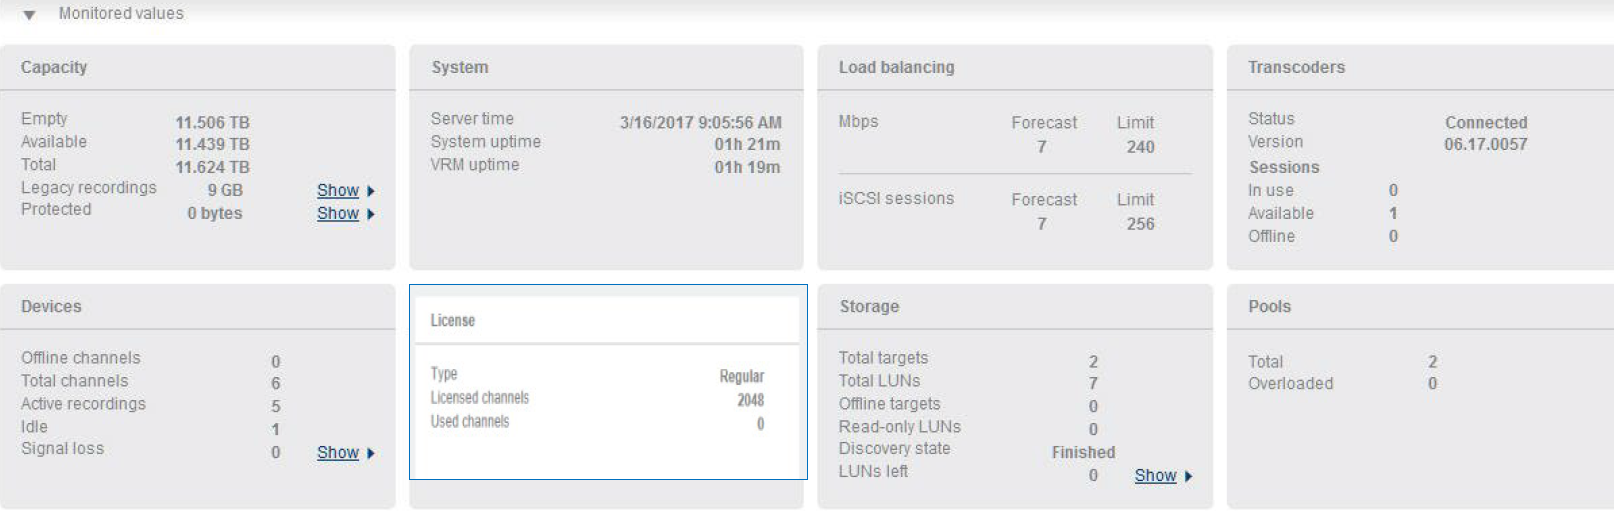
Monitored Values
The “Monitored values” portion of the Monitor page provides a wealth of information on the health and status of the system
-
Capacity menu - provides an overview of the system’s storage and storage status. This includes Total, Available, and Empty storage space. This menu also provides information on Legacy and Protected recordings:
• Legacy Recordings belong to device(s) that are no longer in the system and the minimum retention time of the video has not been reached. If the original device is to be replaced, the original recordings will “re-associate” with the new device -
System menu - provides Time and Date information to include System and VRM uptime
-
Load balancing - provides a “System Wide” overview of the total number of iSCSI sessions and network throughput of all storage devices as they have been configured. This menu also shows the current number of connections and bit rate in a “Forecast” fashion. This is set up in Configuration Client.
-
Transcoders menu - provides information and status of transcoders associated with a VRM system. This includes older VJ-XTC-XF external transcoders as well as internal transcoders supplied by recording appliances.
-
DIP -71 recording appliances are equipped with one (1) internal transcoder capable of one (1) transcoding instance
-
DIP –72, 73 appliances are capable of four (4) simultaneous transcoding session
-
Operator Client (SSH) or Video Security App/Client (HTTPS) can use the transcoder on request.
Prerequisite:
-
VRM installed on same HW then transcoder
-
Transcoder windows service is up and running
-
Devices menu - provides total number of video channels configured in the system to include:
• Offline devices
• Active recordings
• Idle (not recording)
• And Signal Loss devices
If you have a camera that is idle that means it is connected to the system and not recording. Few issues could cause this, the main one being your scheduled and recording settings might be correct for the cameras. Other issues would be if the schedules are correct or if the time and date are off in the camera.
Signal loss means BVMS cannot ping the camera, most likely that cause of this is a network issue or a possible camera malfunction
-
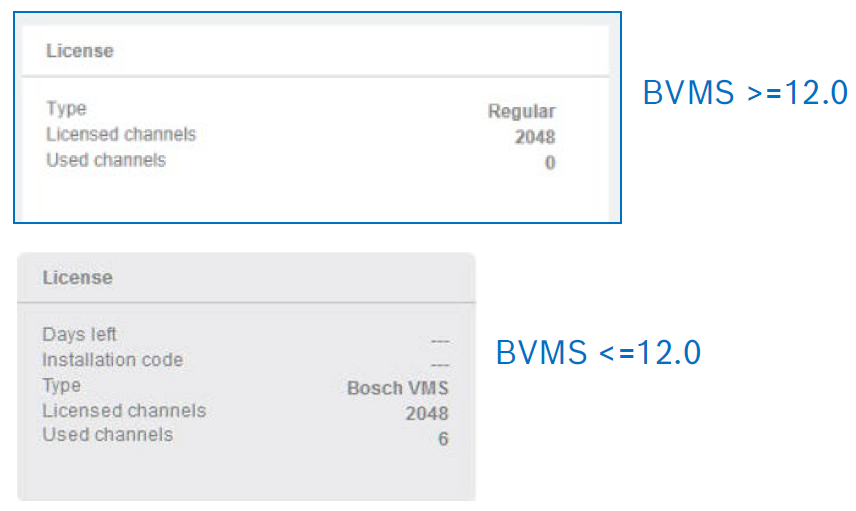
License menu - provides base license information. In the example, the VRM is licensed by the BVMS it is associated with. Note: starting with BVMS 12.x and VRM 4.10 the License type show “Regular”, the VRM does not require a license push from MS anymore.
-
Storage menu - provides a high-level overview of iSCSI devices in the system. This includes the total number of targets in the system, and the number of LUNs configured system wide.
-
Pool menu - provides the number of virtual storage pools that are configured in the system.
-
Bit Rate Graph and Logs
This section of the Dashboard provides two useful tools:
-
The Bit Rate Graph provides real time data of the system’s network throughput to the storage devices. The graph provides filter options that allow the following: 1hour, 1 day, 1 week, or 1 month. There is also the option of filtering based on a date-to-date basis.
In configuration client you set the target and max bit rate for a camera, this gives the cameras encoder room to process the video signal. In a quiet situation (not a lot of motion) the bit rate would be lower. Once the scene gets busier (more motion) the bit rate can spike to what the max bit rate is set at. So say I have a camera overlooking a parking lot of a company. For most of the day the bit rate would be low as there isn’t much going on. But there are three times a day where the parking lot may get busy all at once. In the morning when people are arriving to work, During Lunch, and at the end of the day. Those busy times will create spikes in bandwidth.
So why is all of this important?
The DIVAR IP can only handle a specific amount of bandwidth, also the network might only have a specific amount of bandwidth it can handle. If you are experience video loss or gaps in recording you should check to see if you are getting bandwidth spikes during that time. This will also verify if you did indeed configure the target and max bitrates correctly in the scheduled recording section withing BVMS configuration client.
-
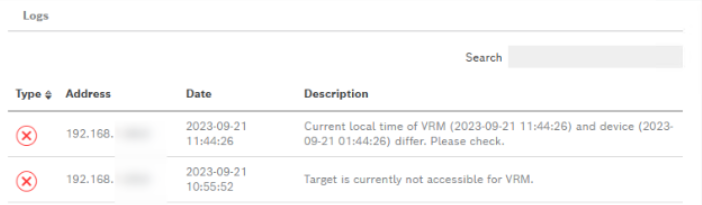
The Logs portion of this section displays the most recent logs, and also provides a shortcut “Go to Logbook”. The Logbook menu allows log filtering and exports.
VRM Peripherals > Devices
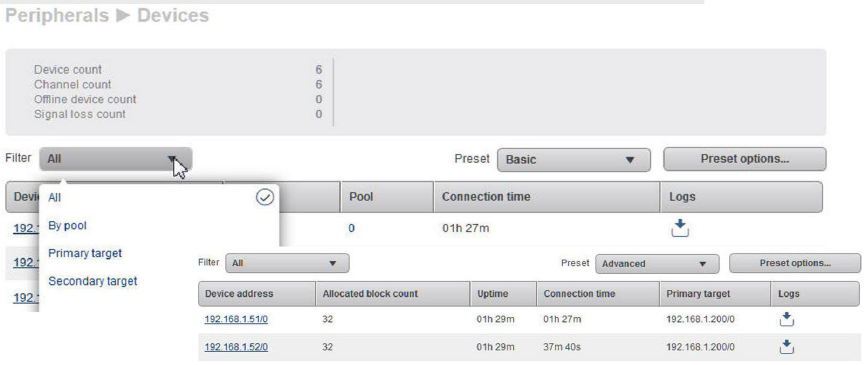
Device count – Displays total number of configured devices.
Channel count – Displays total number of cameras and channels that are configured.
For IP cameras: 1 device = 1 channel.
For encoders / Video Streaming Gateway: 1 device may have multiple channels.
E.g. Videojet multi 4000 = 1 device = 16 video channels
Offline device count – Displays the number of devices that are offline.
Signal loss count – Displays the number of all encoders or Video Streaming Gateway channels that do not receive video data.
Filter – Filter device to show according to list: All, By pool, Primary target & Secondary target.
Preset – Select desired preset from list to display different information: Basic, Advanced & Custom User preset
Preset options – Customize user presets
Selecting the “Preset Options” will display all information modules that can be added as a preset view. The default presets, Basic and Advanced, cannot be modified!
To generate a new information preset, add an existing VRM user by selecting the “+” tab.
Place a check next to the user view to be modified.
Select the information topics to be included.
After saving the user preset, it will now be available in the preset dropdown menu.
VRM Peripherals > Cameras
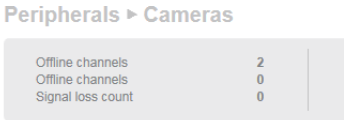
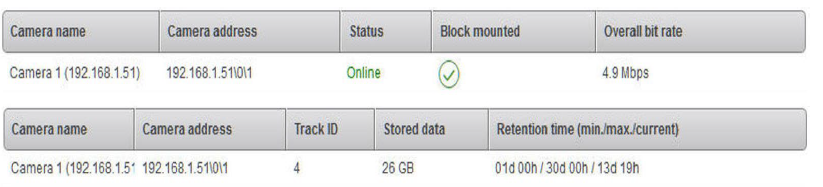
Online channels – Displays the number of cameras and channels that are configured.
Offline channels – Displays the number of cameras and channels that are offline.
Signal loss count – Displays the number of all encoders or Video Streaming Gateway channels that do not receive video data.
Filter – Filter cameras to show according to list: All, By pool, Primary target, Secondary target & By device.
Preset – Select desired preset from list to display different information: Basic, Advanced & Custom User preset
Preset options – Customize user presets
This can be a first spot in troubleshooting why a camera is not recording. If there is a signal loss you may have an issue with the camera itself, ethernet cable, or your network switch. If the camera is offline, you would want to physically check the camera and connection first.
VRM Peripherals > Signal Loss
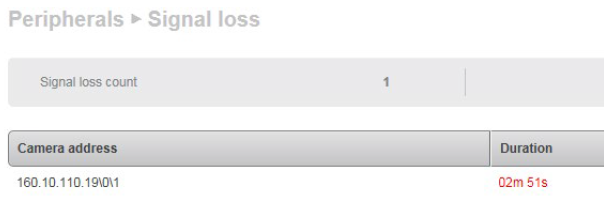
Signal loss count – Displays the number of all encoders or Video Streaming Gateway (VSG) channels that do not receive video data.
Camera address & Duration – Displays IP address of all encoders or VSG channels and elapsed time since signal loss.
Legacy recordings
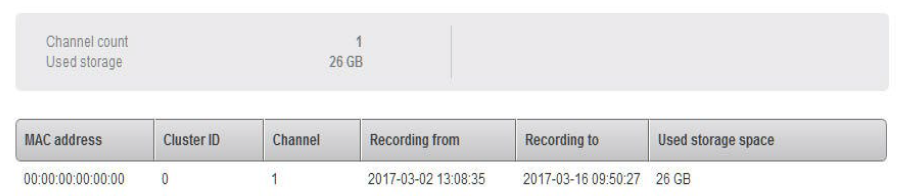
Channel count – Displays the number of unmanaged devices in the system.
Used storage – Displays the storage that is used by unmanaged devices.
Displays storage used for each unmanaged device.
Legacy recordings are recordings on the target that are associated with a camera that is no longer in the BVMS system. There are only two ways to delete those recoding’s, either when the minimum retention time is met or you can delete them in the debug page (HTTP://VRM IP/DBG)
If the original camera is being replaced with another camera you can associate the recordings of the predecessor with the recordings of the camera no longer in the BVMS system.
In Configuration Client, if you right click on the camera in your device tree there is an option called associate recordings with predecessor. As long as both, the original and new camera have the same IP address you can associate the old recordings with the new camera. It does not matter what type of cameras you have.
Please feel free to check the VRM pools module as it has some hands on exercise about the “Associate recordings with predecessor” feature.
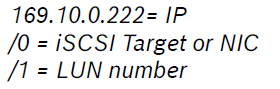
Storage
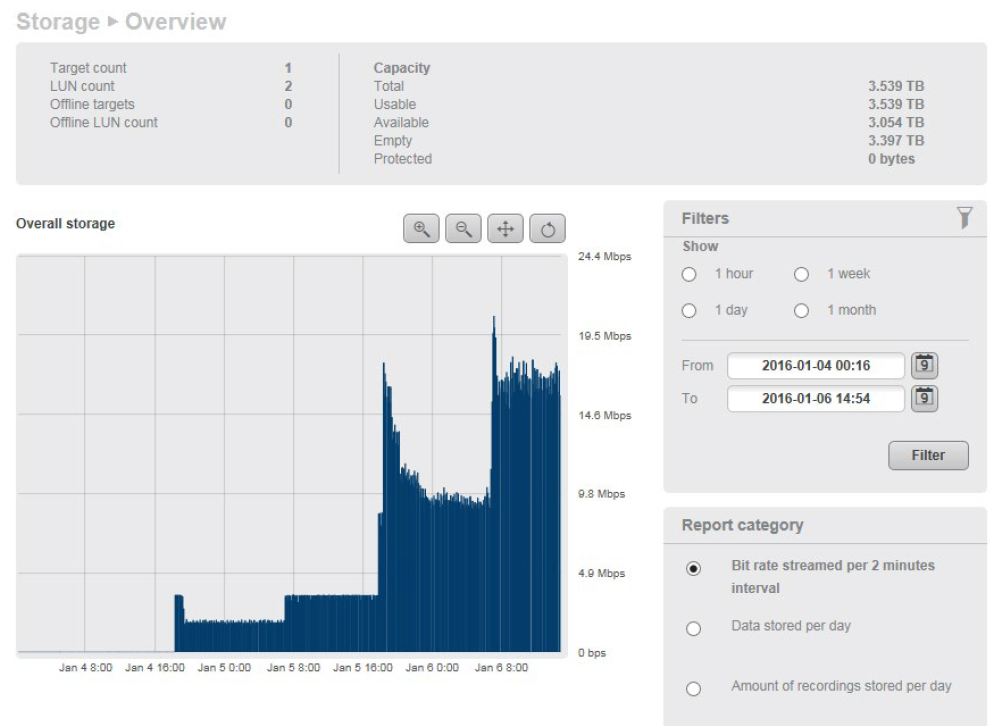
Target & LUN count – Displays the number of all available & offline iSCSI targets & LUNs.
Capacity – Displays the storage capacity of the configured LUN.
Overall storage graph – Displays the storage capacity used against specified time period.
Filters – Configure the graph period to filter.
Report category – Allows exporting of different report categories in CSV format
Similar to the camera bitrate section your storage unit has a limit on the amount of throughput it can handle. If you have issued where is are gaps in your recording you can utilize this graph to see if bandwidth was the cause of the issue, then you can check the camera bitrate graph during the time of the spike to see what camera has caused this.
Lets say you have a situation where you had video loss or maybe even someone complains about network issues. You can check this graph to see if you had a spike in bit rate. A spike can be caused by several factors as in your camera and recording settings, schedules, or how busy the scene is. This graph would show that spike and you can narrow down the time of day this happened. Pairing this with the camera bit rate graph you can then find the camera causing issues. From here you can check your settings to see if that is causing the issue. First thing I would check would be the max bit rate to make sure that is not set too high.
Storage Targets
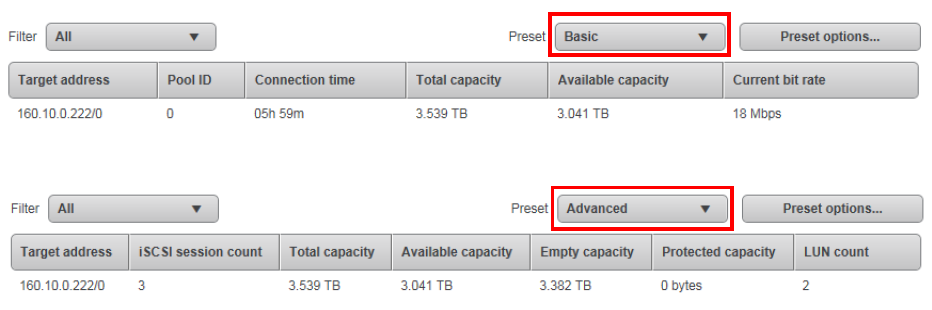
Filter – Filter cameras to show according to list: All & By pool.
Preset – Select desired preset from list to display different information: Basic, Advanced & Custom User preset
Preset options – Customize user presets
Other then overall bit rate that has already been covered this is basically just informational purposes only. You can verify to make sure your VRM is seeing all available storage. If you have more storage devices (Different DIVAR IP’s) in your BVMS system then it shows here then VHDs and LUNS may not have been created or it has to be formatted.
Storage LUNs
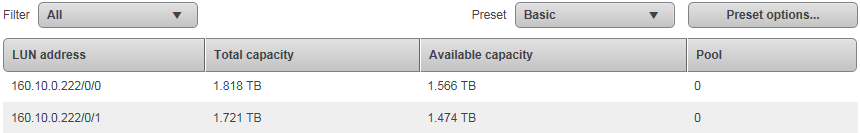
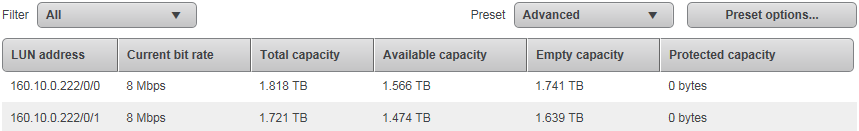
Filter – Filter cameras to show according to list: All & By target.
Preset – Select desired preset from list to display different information: Basic, Advanced & Custom User preset
Preset options – Customize user presets
For informational purposes only: if storage capacity sizes don’t match you would see it here, you may have to change the LUN sizes depending on how large of a system you have.
Also if you notice if LUNS are missing then you may have to recreate the .vhd, LUNs, and format. This is common if you had recently expanded your storage. Creating the VHDs and LUNs will be done in Windows Server Manager and the formatting of the LUNS will be done in Configuration Client.
VRM Monitor – Storage Blocks
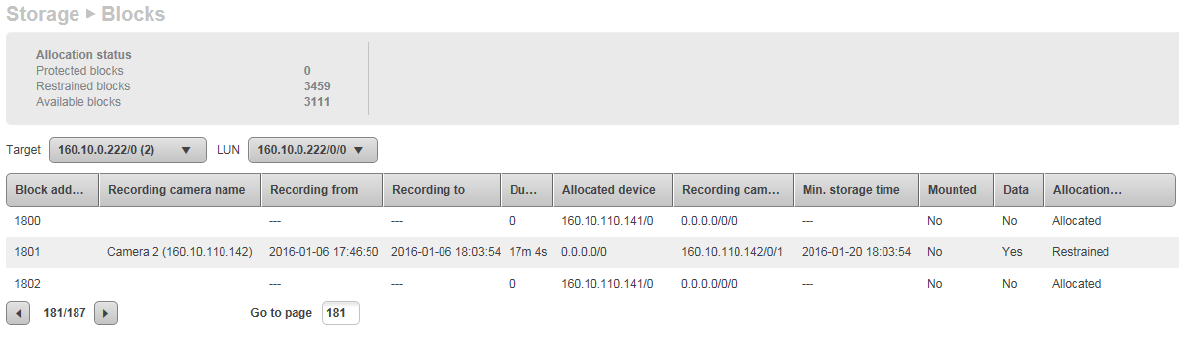
This page provides information of storage blocks on all iSCSI targets.
Allocation status – Displays the number of blocks for: Protected, Restrained & Available.
Displays the all the individual protected block information. Clicking on a line will display the protected block details below.
VRM makes an assumption in a new system that one block of storage is about 6 hours of recording, when you protect video you protect the entire block, furthermore a recording may span the distance of two blocks. So if you protect that recording you will protect two blocks meaning a small video clip could protect 12 hours of video. If the blocks are protected then will never be assigned to another camera meaning the storage is not available anymore. If you are all of a sudden not meeting your retention time anymore and you didn’t add any cameras or change the recording setting you can further troubleshoot to see if you have any protected blocks. VRM monitor page will let you know how much protected video you have and what camera, time, and date the protected video is associate with. You can then used operator client to unprotect the video and free up the blocks.
Protected blocks – Displays the number of all manually protected blocks on all iSCSI targets
Restrained blocks – Number of blocks that cannot be allocated because their retention time is not exceeded. When you assigned a retention time that retention time is written in the header of the block. When that block is assigned to the cameras span list that retention time cannot be changed. Once there is video written to that block that block will remain on your iscsi target until the retention time is met. While it is on your target and before your retention time is met it will be considered a restrained block. Meaning it will not be free to allocate to another span list until that retention time has been meet or exceeded.
Available blocks – Displays the number of all blocks on all iSCSI targets.
Allocation status – Displays the number of blocks for: Protected, Restrained & Available.
Target / LUN – Select the iSCSI target & LUN to view the block information
Displays the all the individual block information of the selected iSCSI target / LUN. Clicking on a line will display the block.
If you are not meeting your retention time you will be able to see what is going on by a block by block basis. If you make a change to retention time that only effects all future assigned blocks but not the blocks currently assigned in the span list of the camera or the blocks that have video on it. This could cause confusion when figuring out retention time. This will show you what the minimum retention time is per block. Also if you have any blocks that are protected as that will also effect your retention time